Prakata
Tujuan: Menggambar Bagan Berdasar Persamaan Matematika
Akibat Kurang Bergaul
Saya juga berharap ada yang memperkenalkan matplotlib atau sejenisnya,
saat saya berkuliah di fakultas teknik.
Dijaman djadoel dahulu adanya Matlab,
itupun saya sama sekali tidak tahu.
Kebetulan skripsi saya terkait dengan akusisi data,
yaitu data realtime yang diambil dari mesin diesel,
dengan gambaran diagram P-V,
yang harus ditampilkan seketika di layar komputer.
Saya pikir, matplotlib adalah peralatan yang tepat,
untuk pembikinan diagram seperti ini.
Dengan maraknya data science dan pemrograman fungsional.
Sekarang saya merasa perlu juga,
untuk memberi gambaran grafik dari suatu rumus matematika, di blog.
Dan juga mengirim gambaran tersebut,
ke telegram atau whatsapp dalam format PNG.
Daripada saya berkeluh kesah,
saya membikin skrip bikinan sendiri berdasarkan tutorial yang ada,
untuk menampilkan grafik berdasarkan rumus,
dengan menggunakan matplotlib.
Daftar Isi
-
Prakata: Daftar Isi
Bahasa Inggris
Artikel ini juga disajikan di blog penulis yang lain, dalam bahasa Inggris:
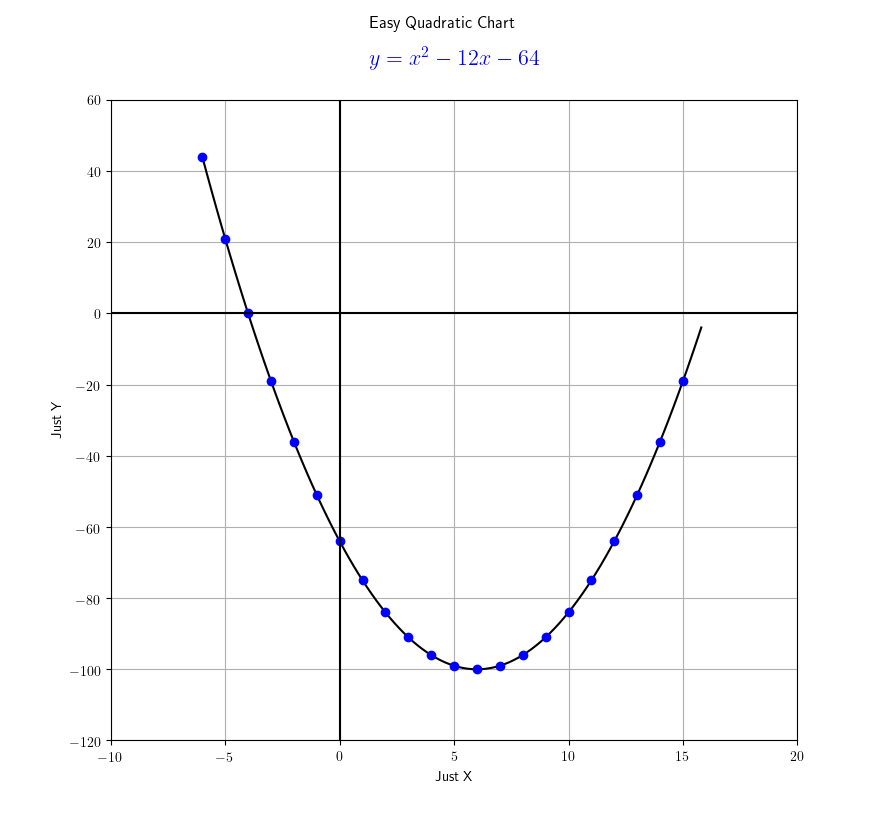
1: Garis Dua Dimensi
$$ y = x^2 - 12x - 64 $$
Skrip python-nya sederhana saja sih.
import numpy as np
import matplotlib
matplotlib.rcParams['text.usetex'] = True
import matplotlib.pyplot as plt

def f(x):
    return x**2 - 12*x - 64

x    = np.arange(-6, 16, 0.2)
xdot = np.arange(-6, 16, 1)

plt.plot(x, f(x), 'k', xdot, f(xdot), 'bo')
plt.axis([-10, 20, -120, 60])

plt.axhline(y=0, color='k')
plt.axvline(x=0, color='k')

plt.grid()
plt.suptitle('Easy Quadratic Chart')
plt.title(r'$y = x^2 - 12x - 64$', fontsize=16, color='b', y=1.04)
plt.xlabel('Just X')
plt.ylabel('Just Y')

plt.show()
Lalu jalankan perintah ini:
$ python yourscript.pyMaka sohib dapat melihat penampakan berikut:
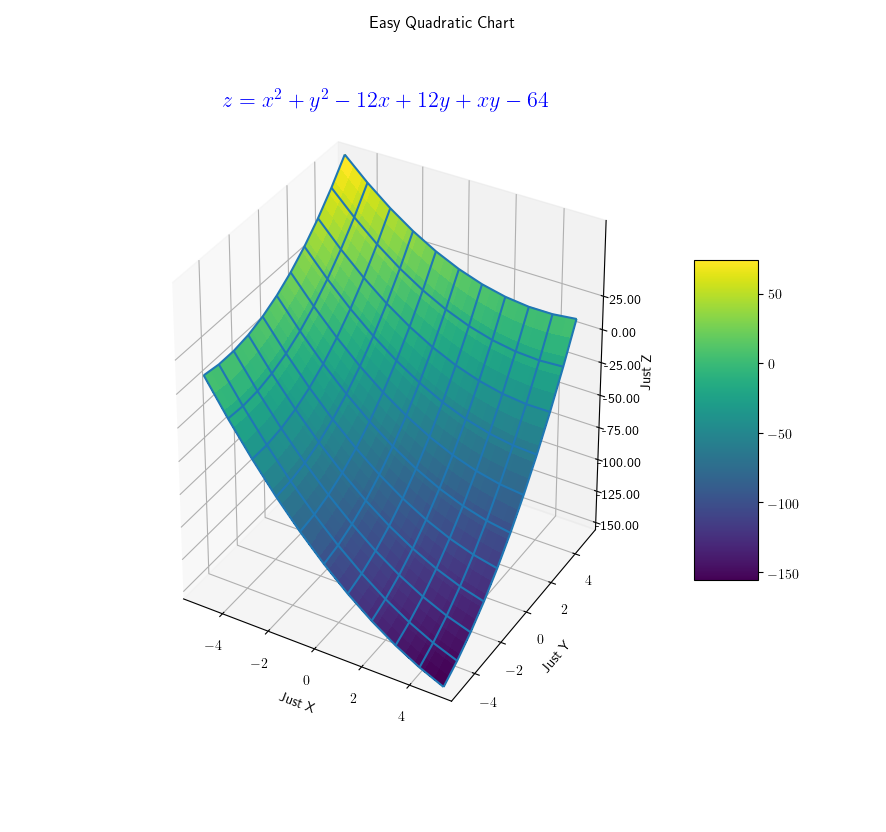
2: Permukaan Tiga Dimensi
$$ z = x^2 + y^2 - 12x + 12y + xy - 64 $$
Skrip python-nya agak lebih panjang sedikit.
# This import registers the 3D projection, but is otherwise unused.
from mpl_toolkits.mplot3d import Axes3D

import matplotlib
matplotlib.rcParams['text.usetex'] = True

import matplotlib.pyplot as plt
from matplotlib import cm
from matplotlib.ticker import LinearLocator, FormatStrFormatter
import numpy as np

def f(x, y):
  return x**2 + y**2 - 12*x + 12*y + x*y - 64

# plot figure

fig = plt.figure()
ax = fig.gca(projection='3d')

# Make data.
X = np.arange(-5, 5.1, 0.2)
Y = np.arange(-5, 5.1, 0.2)
X, Y = np.meshgrid(X, Y)

Xline = np.arange(-5, 5.1, 1)
Yline = np.arange(-5, 5.1, 1)
Xline, Yline = np.meshgrid(Xline, Yline)

# Compute z to make the surface.
Z = f(X, Y)
Zline = f(Xline, Yline)

# Plot the surface.
surf = ax.plot_surface(X, Y, Z, cmap=cm.viridis,
          linewidth=1, antialiased=False)

wire = ax.plot_wireframe(Xline, Yline, Zline)

# Customize the z axis.
ax.set_zlim(-151, 76)
ax.zaxis.set_major_locator(LinearLocator(10))
ax.zaxis.set_major_formatter(FormatStrFormatter('%.02f'))

# Add a color bar which maps values to colors.
fig.colorbar(surf, shrink=0.5, aspect=5)

# Make a 3D quiver plot
x, y, z = np.zeros((3,3))
u, v, w = np.array([[1,1,0],[1,0,1],[0,1,1]])

ax.quiver(x,y,z,u,v,w,arrow_length_ratio=0.1)

# Some decoration
plt.suptitle('Easy Quadratic Chart')
plt.xlabel('Just X')
plt.ylabel('Just Y')
ax.set_zlabel('Just Z', rotation=90)

# set z ticks
ax.set_zticks(np.arange(-150, 50, 25))

# latex
plt.title(r'$z = x^2 + y^2 - 12x + 12y + xy - 64$',
          fontsize=16, color='b', y=1.06)

# finally
plt.show()
Maka sekali lagi, sohib dapat melihat penampakan sebagaimana di bawah:
Penutup
Ya sudah, itu saja.
Saya simpankan kedua skrip tersebut di dalam blog,
supaya saya mudah untuk menemukannya suatu hari.
Menggambar grafik dengan matplotlib cukup menyenangkan.
Bagaimana menurut sohib sekalian?